If you have trouble accessing this document, please contact us to request a copy in a format you can use.
The Department publishes University finance data through visual analytics using Microsoft Power BI.
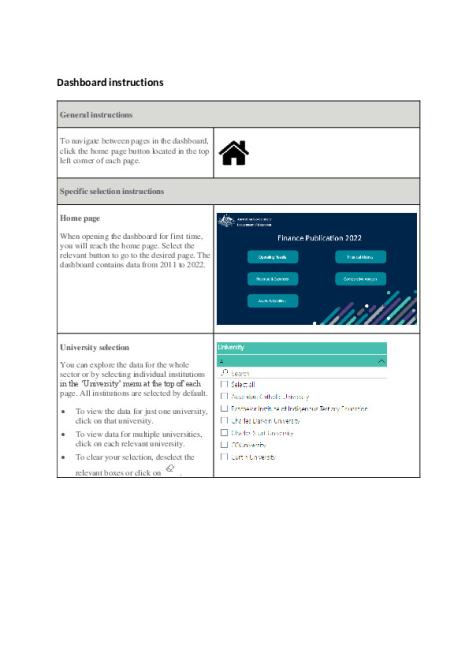
Basic instructions outlining the functionality of these reports can be found in the Brief Guide to Visual Analytics Using Power BI below.
For further information, visit the Financial Reports of Higher Education Providers page.
- Creation Date
-
- Modified date
-
- FOI Reference
-
D23/4866959
- Stream
-
Higher education
- Creator
-
Department of Education, Skills and Employment
- Publication Category
-
Departmental document
- Language
-
English / Australian English
- Coverage
-
Australia
We aim to provide documents in an accessible format. If you're having problems accessing a document, please contact us for help.

